Table of Contents
3.1 15VDC Internal Power Supply: Load regulation.
3.1.2 (Project‑unique identifier of a test) - replicate as required
3.1.6 Other pre‑test preparations - none
3.1.7 Prerequisite conditions - none
3.2 15VDC Internal Power Supply: Transient response
3.2.2 (Project‑unique identifier of a test) - replicate as required
3.2.6 Other pre‑test preparations - none
3.2.7 Prerequisite conditions - none
3.3 Power Supply Section: 15 VDC for I/O
3.4 Power Supply Section: 5 VDC for the logic circuits
3.4.5 Criteria for evaluating results
3.5 Power Supply Section: 340 VDC
3.5.5 Criteria for evaluating results
3.5.7 Assumptions and constraints
3.6.5 Criteria for evaluating results
3.6.7 Assumptions and constraints
3.7.5 Criteria for evaluating results
3.7.7 Assumptions and constraints
3.8.5 Criteria for evaluating results
3.8.7 Assumptions and constraints
3.9.5 Criteria for evaluating results
3.9.7 Assumptions and constraints
3.10 Pin detection sensor inputs
3.10.2 Prerequisite conditions
3.10.5 Criteria for evaluating results
3.10.7 Assumptions and constraints
3.11.2 Prerequisite conditions
3.11.5 Criteria for evaluating results
3.11.7 Assumptions and constraints
3.12.2 Prerequisite conditions
3.12.5 Criteria for evaluating results
3.12.7 Assumptions and constraints
3.13.2 Prerequisite conditions
3.13.5 Criteria for evaluating results
3.13.7 Assumptions and constraints
3.14.2 Prerequisite conditions
3.14.5 Criteria for evaluating results
3.14.7 Assumptions and constraints
1. Scope
1.1 Identification
This Divert Control Module (DCM) is part of the RS-Flex sorter.
1.2 Product overview
Each DCM module controls four magnetic coils. The DCM energizes any combination of the four magnetic coils to divert sorter shoes according to an assigned job from the Divert Manager (DM) via the ProfiBus network interface.
A Slat Sensor (SS) detects the air gap between slats as a reference for counting the number of slats passing by and calculating the sorter speed. One or more slats may have magnets inserted at the front end of the slat for indexing slat numbers. The index slats can be identified by unique magnetic patterns.
Pin detection sensors (proximity sensors) are mounted before and after the four magnetic coils to detect if a shoe assembly has broken during operation.
An optional Divert complete photo-eye is mounted near the takeaways to determine if the assigned shoe pattern from the DM diverted a box. The photo-eye information about the box is relayed back to the DM for job verification. The Divert complete photo-eye is a member of the isolated external I/O provided by the DCM. The DCM provides 3 isolated inputs available for future use.
1.3 Document overview
The purpose of this document is to describe the validation test procedure for the DCM that is part of the RS-Flex sorter.
1.4 Definitions
· DCM - Divert Control Module
· DM - Divert Manager
2. Reference documents
Description Number Notes
·
DCM Power Driver Schematic in directory:
S:\Flex Sorter\DCM\DcmPwrBrd_F0046-00211AC\DcmPwrBrd_F0046-00211AC_09-06-05\
· DCM Controller Board Schematic in the same directory
· DCM PCB Assembly - Power Driver Drawing F0046-00210
· DCM PCB Assembly - Controller Drawing F0046-00220
· DCM - Assembly Drawing F0046-00236
· DCM Controls Hardware Design Specification CHDS-????
·
DCM Controls Software Design Specification CSDS-????
3. Tests
3.1 Preliminary function test
Preliminary testing shows that the DCM does magnetize and demagnetize each of the four coils at the rate expected of the test code. Therefore, +15Vdc is being delivered to the Control Board and the Control Board is operating correctly. The LED’s do light when a Pin sensor senses metal. And there are no glitches associated with using 4 foot long shielded cables to the coils.
3.2 Initial Thermal Survey
Initial thermal survey on the bench in 23ºC ambient found no surprises and everything well within tolerance. See the file ThermalSurvey in the T:\data\Mike Kokinis\Documents\ directory.
The measurements were make by just touching the tip of a K-type thermal couple to each components and held in place until the temperature was stable. So these measurements could be off by a few degrees. This test is only designed to catch surprises. I measured all the IC,s and diodes and power resistors and transformers and transistors, a few places on the PCB itself, and a few places above the board for the ambient temperature near some components. I did not measure every low voltage signal resistor or capacitor. I did measure a few representative signal resistors and capacitors.
The +15 external power supply was then loaded to its 1 A max and the components associated with this supply were measure. Again there were no surprises. Everything seemed to be well within their rated maximum temperatures.
3.3 Power-up High Voltage Levels and Initial Surge Currents
The DCM Power Board is powered by a line voltage between 50Hz – 60Hz, and between 180Vac and 264Vac. The line is rectified by DB1 and charges 4 capacitors, each 1200uF/400V, C22 – C25. To avoid large inrush currents, the capacitors are initially charged through a 510Ω/25W resistor. This limits the initial inrush current to 264*√(2)/510Ω=0.732A. The energy to charge these caps is ½ *CV2=333J. And the time to charge them is 5 time constants (to 99.3% full charge), 5*RC=12.24 seconds, which is an average power of 333J/12.24s=27.2W.
Trace 1 below is an oscilloscope trace showing the charging voltage of the large caps.
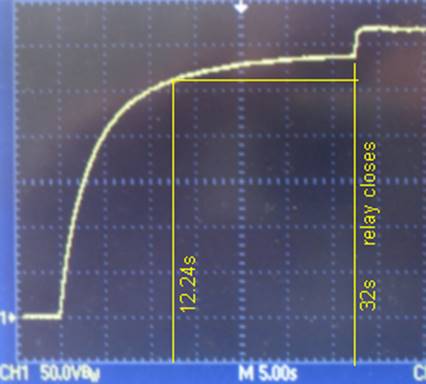
Trace 1.
Why is there a further charge at the end of 32 seconds in Trace 1? For the first 32 seconds the relay is in its normally closed position so that the charging voltage is divided between PTC1 and the series combination of R1, the DB1 diode resistance, and the resistance of the transformer secondary windings that’s between the power line and the board. After the 32 seconds, the relay opens, and PTC1 is no longer in the circuit so that the line voltage is no longer divided and the full line voltage can charge the caps.
At 12.24 seconds the capacitor voltage should be 99.3% of its max charging voltage (here 99.3% of about 290V before the relay closes). The trace shows that the voltage at 12.24 seconds is below this expectation. Why? PTC1 is dividing the line voltage with R1, the rectifier diodes and the transformer resistance. And the PTC1 resistance is increasing with time because the voltage across it creates a current that heats the part. So with more resistance with time, the divider is less effective in pulling down the line and the charging voltage increases.
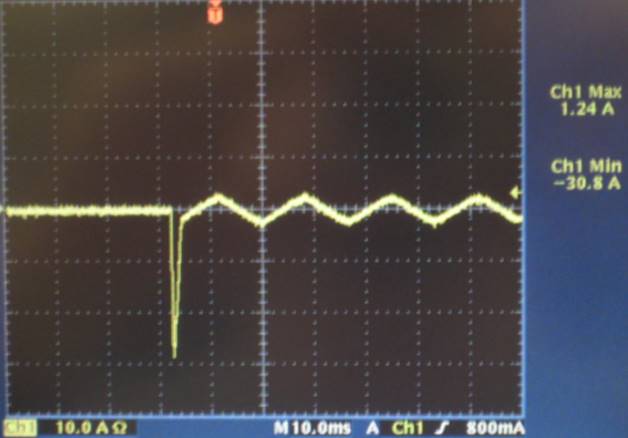
Trace 2 below shows the AC line current going into the Power Board. It shows that a positive peak of 3.96A is captured and a negative peak of -4.48A.

Trace 2
The damped oscillations to the left (above) are where the line power is first switched on. The damped oscillations to the right (32 seconds later) are where the relay closes. These present the worse case charging currents in the large capacitor’s charging circuit.
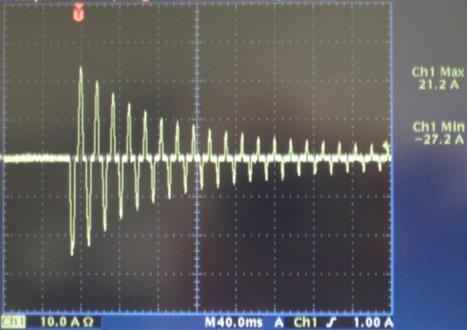
Trace 3 below shows a time expanded version of the first switch-ON current.
Trace 3
Notice there can be as much as a 30.8A initial charge current. This 30A spike is not due to charging the large caps since that is limited by R88 to under 1A. The large spike is due to the charging of C5 through D1 and the charging of C6 through D2. This is the largest peak of a spike that I could capture within 15 attempts. It lasts for 2.63392ms. And it represents a pulse with an I2t rating of:

This current flows through R1, DB1, F2, and F3. And these components should be rated to withstand at least 1 cycle of this I2t rating.
However, it is possible and beyond our control that the line power could be cycled in such a manner that power could be removed before the relay shorts out R88 and then is reapplied even while R88 is still hot from the previous turn-ON cycle. This would cause additional heat to build up in R88. It should be investigated whether R88 can be destroyed by a few cycles of power turned ON and OFF at the right times.
With a thermocouple touching R88, the first power-ON cycle could get R88 up to about 85ºC. A second and third attempt of power cycling before the relay engaged got R88 up to 95ºC.
Normally, the additional charge current encountered when the relay engages is of the order of 5A as seen in Trace 2 above. However, if the line power is removed and then comes back at the right time, it is possible to charge the large caps without R88 limiting the current. This can happen when the power is removed and the caps discharge to about 180Vdc before the relay disengages. Then if the line power comes back on line before the relay disengages, R88 will be shorted out by the relay being closed, and the line voltage will be free to charge the caps to the full voltage only through the resistances of DB1 and R1. Trace 4 below shows this extra charge current encountered when the line voltage is re-established before the relay disengages. A time magnified version of this in shown in Trace_5. Notice that there could be as much as 28.4A peak in these surge currents.

Trace 4 Trace 5
To calculate the I2t current in this pulse, CSV file was captured using the TDS 3052 oscilloscope and brought into Excel where the numerical integration was performed. See this Excel File. The result is shown in Graph_1 below. As can be seen, the graph approaches about 5.5A2s. F2, F3, DB1, and R1 all need to be able to handle this amount of surge. I’ve activated this pulse in the circuit about 10 time with no problem with these components.
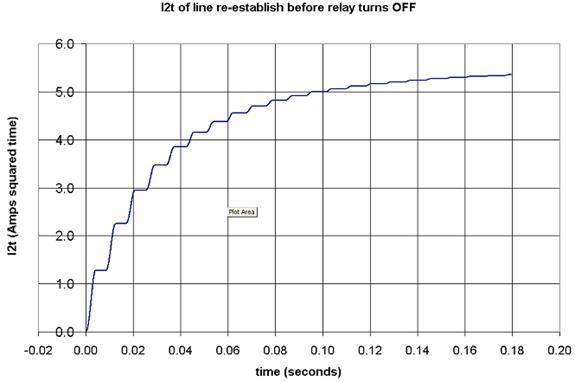
Graph 1
It should be noted that if the coils are running at the time the power is engaged after Vhigh has discharged to 180Vdc, then the coil current will have to be added to the capacitor charge current. This is an unlikely scenario but still possible.
3.4 Steady State Line Currents, Voltages, and Power
After the 32 seconds from initial switch ON, the DCM is ready to start firing magnets. With no magnets being fired, the table below shows Vhigh for given AC line voltage
Line Vhigh
180Vac 258Vdc
190Vac 272Vdc
200Vac 286Vdc
210Vac 300Vdc
220Vac 314Vdc
230Vac 328Vdc
240Vac 344Vdc
250Vac 356Vdc
260Vac 374Vdc
264Vac 376Vdc
270Vac 386Vdc
When magnets are fired, Vhigh is drained as the magnets pull current from the large capacitors; the large caps are then recharges between magnet firings. Trace 6 below shows how the line current (yellow) changes with coil current (blue). All four coils are being pulsed together on every 4th slat time; this is considered the worst case power draw from the DCM. There is a 214ms period between coil activations. The line current draw increases as the coils are fired since the capacitors need to be recharged in addition to the coil current. The current peaks decrease when there are no coils being fired because only the large capacitors are being charged at this time.
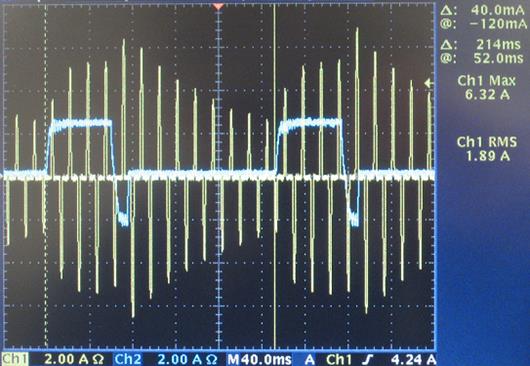
Trace 6
The DCM delivers a constant current to the coils. The coils represent a constant resistance. This makes the DCM a constant power source to the coils. So as the AC line voltage decreases more AC line current will be required to maintain the fixed value of power supplied to the coils. The greatest current draw is obtained at the lowest AC line voltage, which is 180Vac.
Trace 7 below shows the AC line current (yellow) when the AC line voltage to the DCM is set to 180Vac as measured by the Fluke 189 True RMS meter. The scope is set to measure the RMS current of the AC line between the cursors adjusted to an whole number of coil cycles. Trace 7 shows that Irms=2.03A, whereas the peak can be Ipk=6.48A. (The coils are configured to run at 2.5A max.)
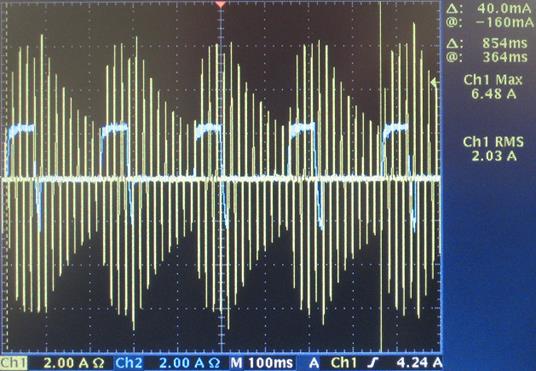
Trace 7
Even though the overall RMS line current is 2A, experience shows that a mere 2A or 3A line fuse will blow in this application. It would seem that the current peaks alone are capable of blowing fuses. When the individual line current peaks of Trace 7 are treated as pulses, an I2t rating can be calculated for various numbers of pulses. The waveform of Trace 7 was digitally captured and put into an Excel file located at: T:\data\Mike Kokinis\scopedata\ Line current of pulsing 4 coils.xls. From this file Table 1 below shows the RMS of the current and the equivalent 12t rating for a given number of pulses. The highest peak was used for “1 pulse”, and the two most highest consecutive peaks were used for “2 pulses”, etc.
|
No. of pulses |
Time interval in file |
RMS for that Interval |
Equivalent I2t |
|
1 pulse |
0.4518 - 0.4484 |
4.60 Arms |
0.0719 A2s |
|
2 pulses |
0.4518 – 0.4400 |
3.53 Arms |
0.147 A2s |
|
3 pulses |
0.4518 – 0.4317 |
3.15 Arms |
0.199 A2s |
|
4 pulses |
0.4518 – 0.4233 |
3.01 Arms |
0.258 A2s |
|
5 pulses |
0.4518 – 0.4150 |
2.97 Arms |
0.325 A2s |
|
6 pulses |
0.4518 – 0.4067 |
2.91 Arms |
0.382 A2s |
|
7 pulses |
0.4518 – 0.3984 |
2.88 Arms |
0.443 A2s |
|
8 pulses |
0.4518 – 0.3901 |
2.83 Arms |
0.494 A2s |
Table 1
If it becomes necessary to consider longer durations, Graph 2 below shows the I2t rating of the current pulse of the line current (yellow Trace 7). This I2t is calculated starting from the first activation of the coils.
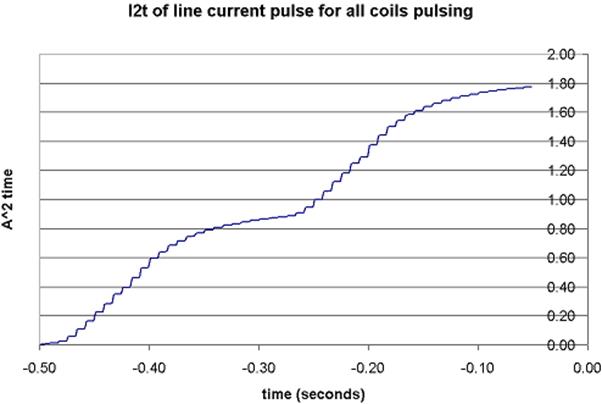
Graph 2
Remember, if the DCM is powered through a step-up transformer to get the 240Vac, then the primary current will be twice, and a 5A fuse for the secondary will require a 10A fuse for the primary.
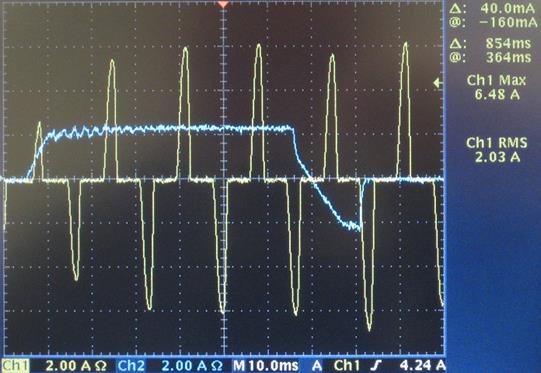
Trace 8
Trace 8 above shows that the AC line current is not being drawn from the line for the full sine wave of the line voltage. The current is being drawn only as the line voltage reaches a peak larger than the capacitor voltage. This fact together with how the current peeks are changing so dramatically during the 214ms period can make it difficult to measure the power consumption of the DCM during coil pulsing. The EXTECH 380947 and the EXTECH 382860 with the Power Adapter were compared to the measurement and math functions of the Tektronix TDS3052 and were found to agree within 5%.
Measurements were taken of the power consumption and the max/mean/min of the 340Vdc high voltage at various AC line voltages to the DCM. The measurement and math functions were used on the TDS3052 oscilloscope. The DCM is set to pulse all four coils on every 4th slat time. Table 2 below shows the results along with the percent ripple on the 340Vdc, Vhigh, power supply.
|
Line Vac |
4 coils |
3 coils |
2 coils |
1 coils |
No coils |
Standby |
|
180 |
233W |
194 |
132 |
72 |
10.03 W |
4.17 W |
|
200 |
259W |
210 |
146 |
80 |
10.9W |
4.15W |
|
220 |
278 |
227 |
160 |
87 |
12.1W |
4.3W |
|
240 |
295 |
241 |
170 |
93 |
13.1W |
4.3W |
|
264 |
310 |
253 |
179 |
100 |
14.5W |
4.5W |
Table 2
With coils not pulsing but constantly ON, power dissipation and current for the DCM were measured using the TDS3052. Table 3 below shows the power and current used at various voltages with different numbers of coils connected. The 340V high voltage level is shown as well as well as the line current being drawn by the DCM.
|
Line Vac |
4 coils |
3 coils |
2 coils |
1 coils |
No coils |
|
180 Vac |
371 |
313 |
212 |
125 |
20 |
|
200 Vac |
392 |
314 |
215 |
129 |
22 |
|
220 Vac |
400 |
314 |
219 |
132 |
24.4 |
|
240 Vac |
404 |
315 |
221 |
134 |
27 |
|
263 Vac |
4.02 |
317 |
224 |
137 |
30.7 |
Table 3
Trace 9 below shows the AC line current at 180Vac line voltage when the DCM is set to leave all four coils ON constantly. Notice that the current peaks are near 7A, and this is the largest current recorded for the DCM.
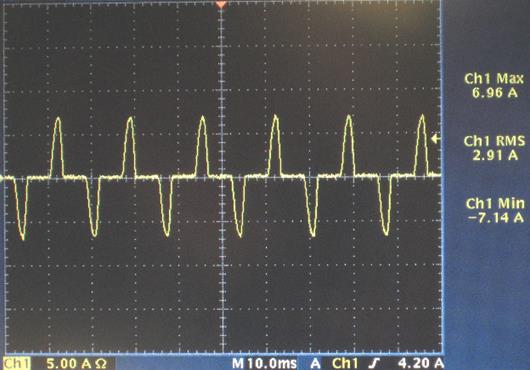
Trace 9
Graph 3 below shows the RMS current that the DCM uses verses the duration that the pulses in Trace 9 continue. Graph 4 below shows the I2t rating for the pulse in Trace 9 verses time. These graphs can be use to help spec out a fuse.
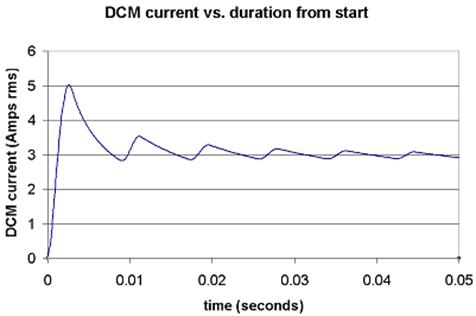

Graph 3 Graph 4
3.5 15VDC Internal Power Supply: Load regulation
The internal 15Vdc is available on pin 1 of J2 on the power board; the return is pin 2. And the J1 pins can be accessed after disconnecting the controller board from the power board. This 15Vdc supplies only two step-down switch mode power supplies. One switcher provide +5Vdc (VCC) to the Control Board logic circuitry. The other switcher provides itself two +5Vdc (VCC2 and VCC3). VCC2 is used for the ProfiBus, VCC3 is used for the Slat Sensor.
3.5.1 Test description
Voltage regulation of the internal 15Vdc is tested to make sure it does not vary much over various loads and input voltages.
3.5.2 (Project‑unique identifier of a test) - replicate as required
3.5.3 Requirements addressed
1- Output voltage range 14.72Vdc – 16.28Vdc over supply voltage range 180-264VAC and load currents from 0.1A – 2A.
2- Output power available 15 Watts minimum continuous.
3- Above requirements must be met during a sustained worst-case coil firing scenario.
4- Overcurrent protection supplied, to self-protect this supply in case of overload or short circuit.
5- Above requirements must be met over ambient temperature range of -0 to +60 ºC.
3.5.4 Hardware preparation
With the power board removed from the DCM enclosure and the controller board disconnected from the power board, the power board can be put on the bench by itself with nothing but the power cable and the coils connected as needed.
3.5.5 Software preparation
Since the 15Vdc supplies operate independently of the controller board, no software preparations are required.
3.5.6 Other pre‑test preparations - none
3.5.7 Prerequisite conditions - none
3.5.8 Test inputs
Various resistors were placed across the 15Vdc and voltage and current measurements were made.
3.5.9 Expected test results
This 15Vdc supply functions exactly like the 15Vdc external supply. So it is expected to maintain 15.5Vdc ± 5% with a current draw from 0.1A to 2A.
3.5.10 Test procedure
Without
coils connected, plug the power board into the AC line voltage through a variac
that can adjust the voltage to the board from 180Vac to 264Vac.
Set up the test circuit as shown below on J2 of the power board: “V” is any
dc voltmeter that measures at least between 0V and 20V. “I” is any dc amp meter
that will measure up to 10A.
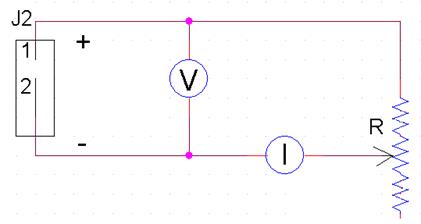
Adjust R to give various currents as shown in the table in the “Test results” section below and record the voltage.
Make a table and graph of these measurements using Microsoft Excel.
3.5.11 Test results

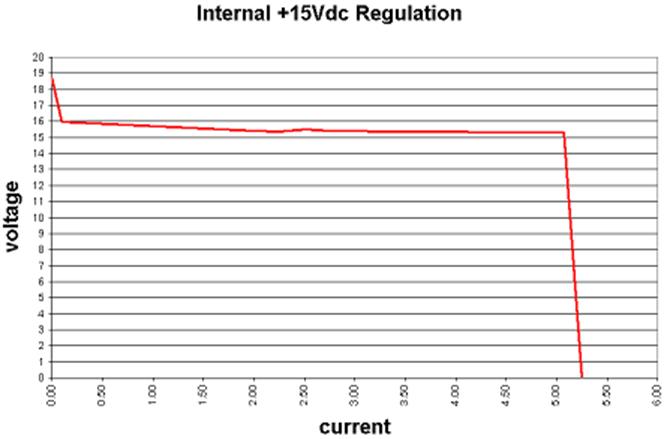
As can be seen from the graph, at about 5.25Adc the power supply gets hot and goes into thermal shutdown.
When the power supply was directly shorted out, the voltage became zero, of course, but it would recover and supply the expected voltage even after 10 minutes of being shorted.
The variac was adjusted
between 180Vac to 264Vac while the current was at 0.1A and at 2.0A. There was
no perceivable change in the 15V output.
3.5.12 Test Conclusions
The results show that the 15V internal supply is able to supply 15W and regulates well within the input and output demand expected of it. The supply is capable of handling a direct short without damage. The thermal protection starts operating at about 5A. And since 15Vdc supplies operate well under large changes in the line voltage, it is expected that loading of the line voltage due to the draw of coil currents will not affect operation of the 15V supplies.
All the pin sensors and slat sensors were connected to a unit that was put in a Thermotron and cycled between 0ºC and 60ºC. This was done in a separate thermal cycling test. The 15V external supply worked as expected and the internal supply is expected to work the same as the external supply.
3.6 15VDC Internal Power Supply: Transient response
The internal 15Vdc voltage supply is available and accessible in the same manner as in test 3.1 above.
3.6.1 Test description
Transient response tests the reaction of the 15Vdc output as the load current is changed from 10% of it maximum rating to 90% of its maximum rating. The supply voltage may vary some with load, but it should not oscillate due to sudden changes.
3.6.2 (Project‑unique identifier of a test) - replicate as required
3.6.3 Requirements addressed
1 - Output voltage should stay within the range of 13.72Vdc – 16.28Vdc
2 - Any oscillations observed should be damped completely within 5 cycles.
3.6.4 Hardware preparation
Same as in 3.1.4. No coils are connected in this test.
3.6.5 Software preparation
Same as in 3.1.5
3.6.6 Other pre‑test preparations - none
3.6.7 Prerequisite conditions - none
3.6.8 Test inputs
A load that can be switched by a transistor between 10% of max current to 90% of max load is connected to the 15Vdc supply and switched by a square wave generator.
3.6.9 Expected test results
If the phase and gain of the 15V switch mode power supply is adjusted correctly, any oscillations that might result from a fast transition of the load current or the input voltage should be damped and not continue to ring.
3.6.10 Test procedure
Construct a circuit as shown below to provide a switchable load.
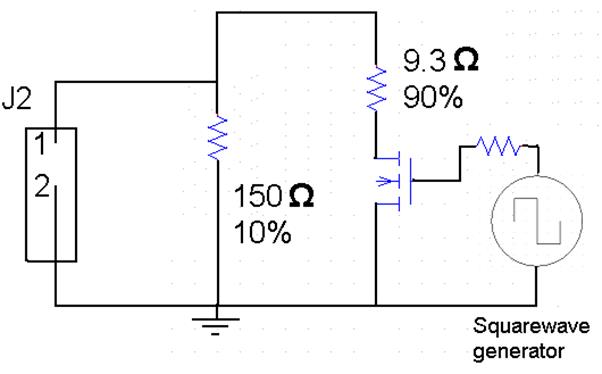
The 150Ω resistor must dissipate 1.5W, the 9.3Ω resistor must dissipate 24W. Use an IRG4BC20S MOSFET for the transistor. The signal generator was the hp8005 pulse generator set to provide a 0V – 10V, 1000Hz, 50% duty cycle square wave.
This was connected to J2 of the power board with no coils being operated.
Connect the power cable to the power board through a variac that can provide 180Vac-264Vac.
Connect an electrically isolated oscilloscope to pin1 and pin2 of J2, and observe the voltage waveform at various time scales and input voltages.
Record the waveforms by taking a picture of them.
3.6.11 Test results
Below are some pictures of the internal 15Vdc power supply voltage.

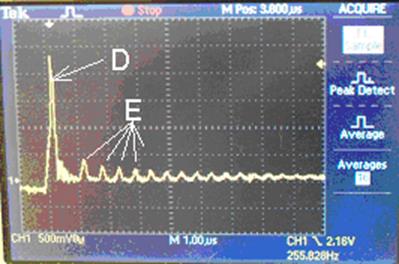
Notice that the first waveform on the left is on the scale of 1.00ms/div, and the waveform on the right is on the scale of 1.00us/div. Both have a vertical scale of 500mV/div. The waveform on the right show a time magnified version of the spike “C” on the left.
It is believed that the small, damped oscillations labeled “A” and “B” on the left are associated with is the phase and gain of the feedback loop of the switch mode power supply. It can be seen that this oscillation is well under control and there is no need to worry about fast load changes sending the output into sustained oscillations.
The spike labeled “C” on the left and amplified on the right as “D” is thought to be due to the output inductor as is not the wave for of interest. Even if it were, the waveform shows that these oscillations, “E”, are damped as well.
Art Nice was the consultant who helped us interpret these results.
3.7 Power Supply Section: 15 VDC for I/O
The 15Vdc for external I/O is available on pin 5 of J2 on the power board. This is tested in exactly the same manner as for the internal 15Vdc supply and will not be repeated here.
3.8 Power Supply Section: 5 VDC for the logic circuits
The 5Vdc supply for the logic circuits is designed to supply 5W with 1A max and 5Vdc ±5%. It’s a switch mode power supply designed around a LT1424CS8-5 exactly like the 5Vdc supplies for the ProfiBus and the Slat Sensor, except the logic supply has both secondaries of the transformer connected in parallel whereas the ProfiBus and the Slat-Sensor supplies each come from only a single secondary from the same kind of transformer.
The logic +5Vdc (VCC) is available by removing one leg of L3, and the joining leg of C34, and joining them off the board and connecting to their conjunction.
3.8.1 Requirements addressed
1- Output voltage range 5.25Vdc to 4.75Vdc over the load range of 0.1A to 1A.
3- Output power available 5W minimum continuous.
5- Overcurrent protection self-protects this supply in case of overload or short circuit.
6- Above requirements must be met over ambient temperature range of 0ºC to +75 ºC.
3.8.2 Prerequisite conditions
The hardware, software, Other pre-test preparations, Prerequisite conditions, and Test inputs are the same as in 3.1.4 to 3.1.8 with obvious changes for 5Vdc.
3.8.3 Expected test results
This 5Vdc supply is expected to maintain 5Vdc ± 5% (±0.25Vdc) for the range of 0.05A to 1A.
3.8.4 Test procedure
The test procedure for this 5Vdc supply is exactly the same as for the 15Vdc supply in 3.1.10, except that the node joining L3 and C34 is joined separately from the PCB and is connected to the adjustable test circuit.
Also, R is adjusted from
3.9 Power Supply Section: 340 VDC
3.9.1 Requirements addressed
1- Output voltage range x - y VDC over supply voltage range 180-260??? VAC.
2- Output voltage ripple <5% over supply voltage range 180-260??? VAC.
3- Output power available 72 Watts minimum. (continuous???)
4- Above requirements must be met during a sustained worst-case coil firing scenario.
5- Above requirements must be met over ambient temperature range of -0 to +50 ºC.
3.9.2 Prerequisite conditions
3.9.3 Test inputs
3.9.4 Expected test results
3.9.5 Criteria for evaluating results
3.9.6 Test procedure
3.9.7 Assumptions and constraints
3.10 External user interface
3.10.1 Requirements addressed
1- LED indicators are provided to display status information about the coils, slat sensor, pin detect sensors, and faults.
2- A push button is provided for individual manual activation of each coil.
3.10.2 Prerequisite conditions
3.10.3 Test inputs
3.10.4 Expected test results
3.10.5 Criteria for evaluating results
3.10.6 Test procedure
3.10.7 Assumptions and constraints
3.11 Profibus interface
3.11.1 Requirements addressed
1- Interface is compatible with applicable Profibus standards.
2- Above requirements must be met over product design operating environment and supply voltage range.
3.11.2 Prerequisite conditions
3.11.3 Test inputs
3.11.4 Expected test results
3.11.5 Criteria for evaluating results
3.11.6 Test procedure
3.11.7 Assumptions and constraints
3.12 External auxiliary inputs
3.12.1 Requirements addressed
1- Three inputs must be provided for external interface uses.
2- The three inputs are activated by applying X-Y VDC to the input line.???
3- These inputs must be optically isolated from other circuits.
4- The inputs must consume a nominal 6 mA with 15 VDC applied.
5- Provision must be provided for connection and use of external or internal power sources.
6- The DCM must provide power of 15 V / 25 mA to each input device.
7- These inputs must available for monitoring via the Profibus interface.
3.12.2 Prerequisite conditions
3.12.3 Test inputs
3.12.4 Expected test results
3.12.5 Criteria for evaluating results
3.12.6 Test procedure
3.12.7 Assumptions and constraints
3.13 Slat sensor inputs
3.13.1 Requirements addressed
1- The DCM must provide input connection for the 0-5 V analog input signals slat from the gap and index slat sensors that are part of this slat sensor unit.
2- The DCM must accept and properly process the signals received from the slat sensor unit as defined in HDS-096532-0X Slat Sensor(Vendor).
3- The DCM must provide power of 5 V / 50 mA for both sensors of the Slat sensor unit.
3.13.2 Prerequisite conditions
3.13.3 Test inputs
3.13.4 Expected test results
3.13.5 Criteria for evaluating results
3.13.6 Test procedure
3.13.7 Assumptions and constraints
3.14 Pin detection sensor inputs
3.14.1 Requirements addressed
1- The DCM must provide input connection for the digital signals from the two sensors that detect the pin of each shoe assembly.
2- The DCM must accept and properly process the signals received from the two pin detection sensors.
3- These inputs must be optically isolated from other circuits.
4- The DCM must provide power of 15 V / 25 mA for each sensor.
3.14.2 Prerequisite conditions
3.14.3 Test inputs
3.14.4 Expected test results
3.14.5 Criteria for evaluating results
3.14.6 Test procedure
3.14.7 Assumptions and constraints
3.15 Magnetic switch outputs
3.15.1 Requirements addressed
1- The DCM must provide four magnetic switch outputs to control the coils.
2- Each magnetic switch must be isolated from the microcontroller.
3- Each switch must be capable of XXX VDC output at 1 Amp with 20k Hz PWM.???
4- Each switch must function to “break before make” when reversing polarity to demagnetize the coil.
3.15.2 Prerequisite conditions
3.15.3 Test inputs
3.15.4 Expected test results
3.15.5 Criteria for evaluating results
3.15.6 Test procedure
3.15.7 Assumptions and constraints
3.16 Storage environment
3.16.1 Requirements addressed
The DCM must be capable of being stored for an indefinitely long time under the following conditions, with no physical or operational degradation.
1- Temperature -40 to +70 ºC.
2- Relative humidity 0 to 100% relative humidity, including condensation.
3- Altitude -200 to 10,000 feet above sea level.
4- Shock up to 20G in any axis.
5- Vibration up to 5G in any axis, 5 to 100 Hz.
3.16.2 Prerequisite conditions
3.16.3 Test inputs
3.16.4 Expected test results
3.16.5 Criteria for evaluating results
3.16.6 Test procedure
Any number of the above requirements must be chosen to be part of the validation testing. Each chosen requirement will require a sub-procedure that explains the test procedure in adequate detail.
3.16.7 Assumptions and constraints
3.17 Operation environment
3.17.1 Requirements addressed
The DCM must be capable of being operated continuously under the following conditions, with no physical or operational degradation or as allowed by the referenced test standard.
1- Temperature -0 to +60 ºC.
2- Relative humidity 0 to 95% relative humidity, without condensation.
3- Altitude -200 to 10,000 feet above sea level.
4- Shock up to 10G in any axis.
5- Vibration up to 5G in any axis, 5 to 100 Hz.
6- Electrostatic Discharge, EN 6100-4-2; Criteria B, ±8kV direct contact, ±15kV non-contact through air.
7- Radiated Electric Field, EN 6100-4-3; Criteria A, 10V/M, 26MHz to 1GHz.
8- Fast Transient/Burst, EN 61000-4-4; Criteria B, ±2KV direct, ±4KV capacitive discharge.
9- Conducted RF>9KHz, EN 61000-4-6; Criterial A, 10VRMS, 150KHz to 100MHz.
10- Magnetic Field, EN 61000-4-8; Criteria A, 30AMP/M, 50Hz.
3.17.2 Prerequisite conditions
3.17.3 Test inputs
3.17.4 Expected test results
3.17.5 Criteria for evaluating results
3.17.6 Test procedure
Each of the above requirements will require a sub-procedure that explains the test procedure in adequate detail.
3.17.7 Assumptions and constraints
3.18 Mechanical
3.18.1 Requirements addressed
1- The DCM easily insert into the sorter and mount satisfactorily on the provided mounting brackets.
2- The connectors on the DCM must be as described in the DCM hardware design specification.
3- The DCM enclosure must satisfy the requirements found in the DCM hardware design specification.
3.18.2 Prerequisite conditions
3.18.3 Test inputs
3.18.4 Expected test results
3.18.5 Criteria for evaluating results
3.18.6 Test procedure
3.18.7 Assumptions and constraints